Statistics Report
Statistics Report Of Total Number of People Enlightened
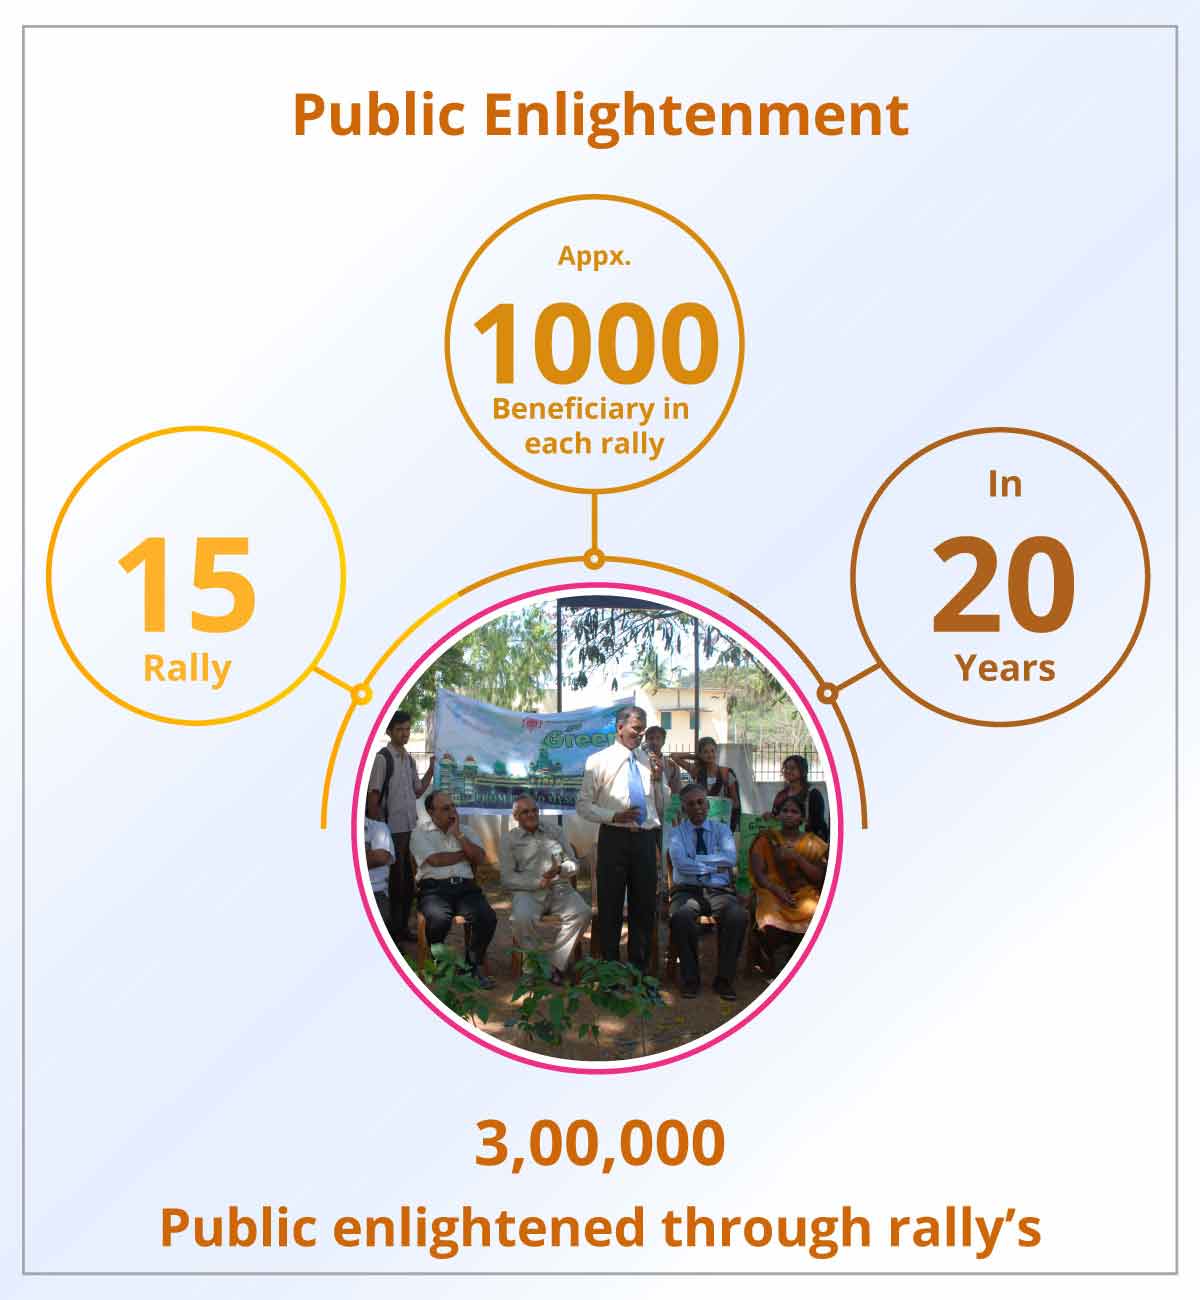
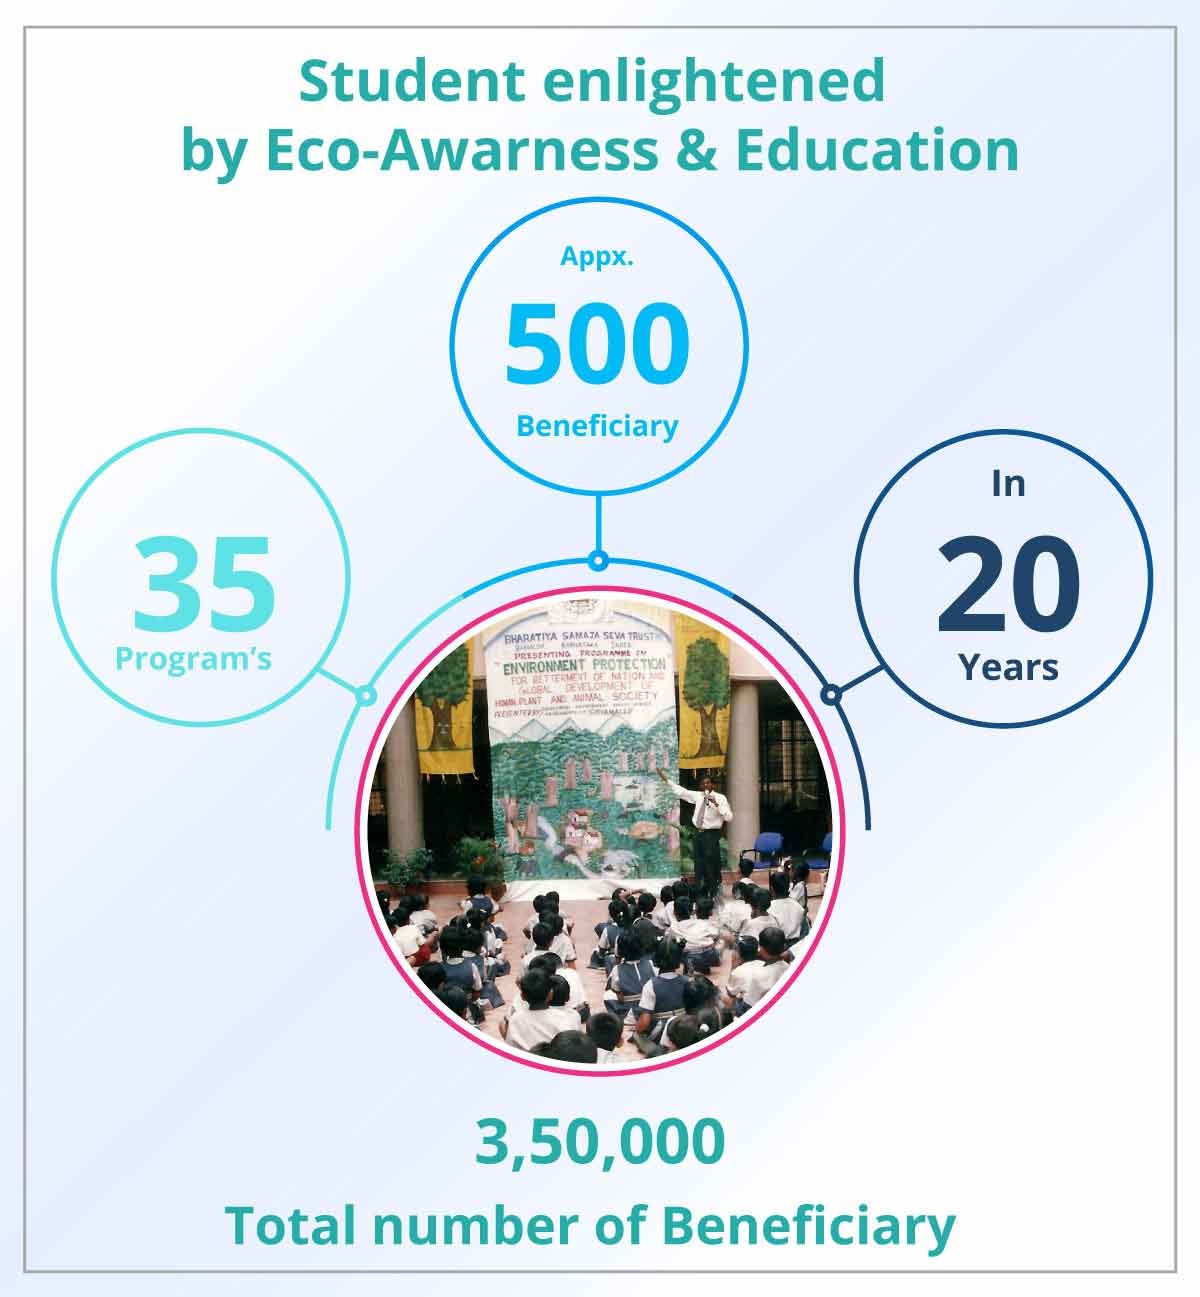
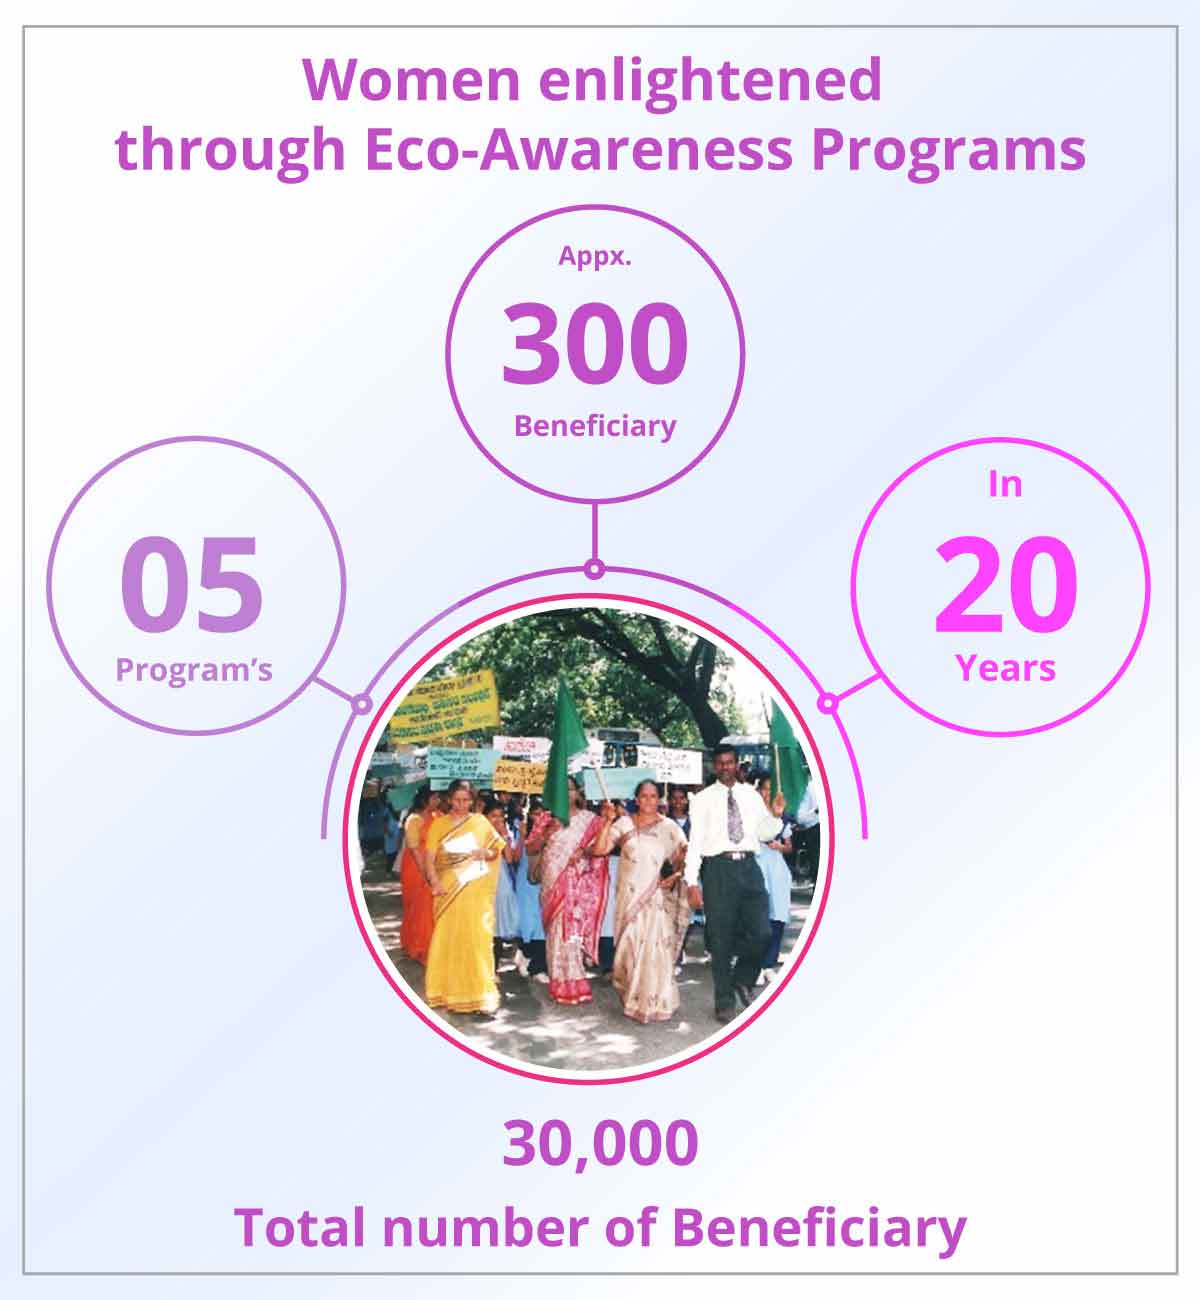
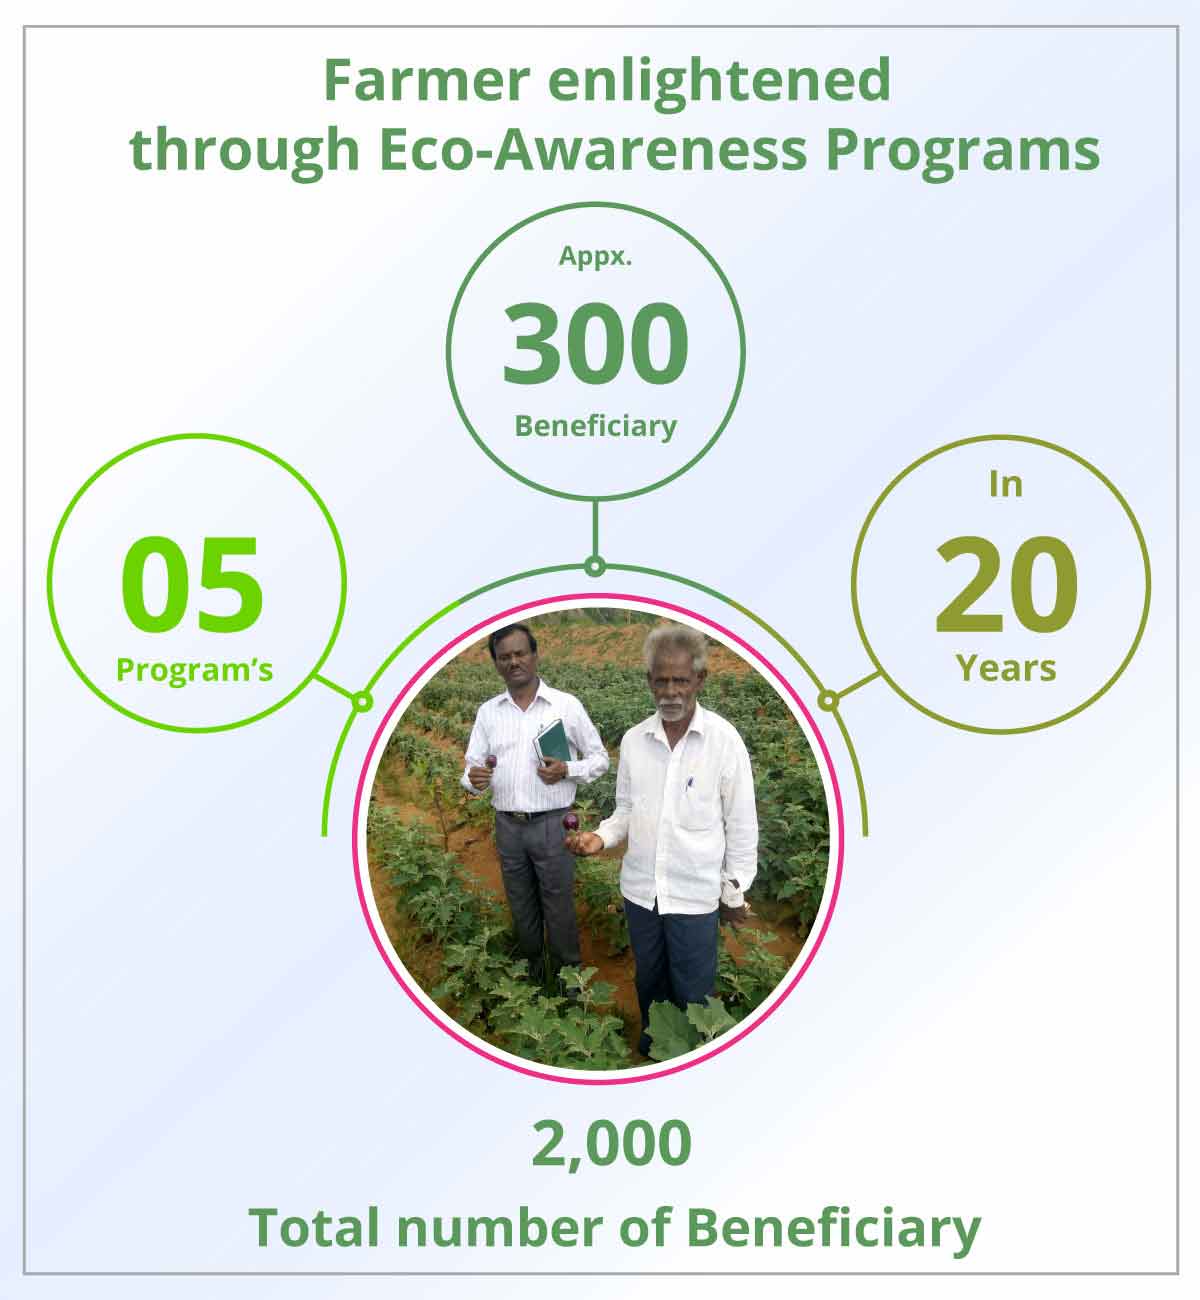
Statistic report of total number of public, student, women and farmers enlightened through our “Save Earth and Environment to Save Life’ Service Programs by understanding What is environment? What is environmental pollution? How pollution generating in the environment? What are all the adverse effects of pollution? How pollution adversely effecting to our future? What are all the precautionary action to be initiated to safeguarding of our health? Etc., in the last 20 years is as follows: -
| Sl. No. | Name of the Program | No. of Programs Organized in a Year | No. Programs Organized in No. of Years | Approximate Beneficiaries in Each Program | Total No. of Beneficiaries |
|---|---|---|---|---|---|
| 2 | Public Enlightened Through Public Rally ‘Environment Protection at Layouts’ | 15 | 20 | 1000+ | 3,00,000+ |
| 1 | Student Enlightened Through Eco-Education Cum-Awareness at Schools and Colleges | 35 | 20 | 500+ | 3,50,000+ |
| 3 | Women Enlightened Through ‘Group House Environment Program’ | 5 | 20 | 300+ | 30,000+ |
| 4 | Farmers Enlightened Through ‘Clean India, Green India, Healthy India’ | 2 | 20 | 50+ | 2,000+ |
Total No. of citizens enlightened |
6,82,000 |
||||
STATISTICS REPORT OF TOTAL NUMBER OF TREE SAPLINGS DISTRIBUTED, PLANTED AND GROWN TREES
The static report of total numbers of Saplings distributed through our “Save Earth and Environment to Save Life’ Service, total numbers of saplings planted by the eco-lovers and total numbers of Trees grown in the last 20 years is as follows: -
| Sl. No. | Name of the Program | No. of Program organized in a year | No. of years organized | Total No. of Tree Saplings distributed | Total No. of Tree Saplings Planted (Colm no.3x4x5) | Total No. of Trees Grown |
|---|---|---|---|---|---|---|
| 1 | Public Plantation | 3 | 3 | 500 | 4,500 | 4,500 |
| 2 | Public Rally | 15 | 20 | 500 | 1,50,000 | 1,50,000 |
| 3 | Eco-Education | 35 | 20 | 300 | 2,10,000 | 2,10,000 |
| 4 | Group House | 5 | 20 | 100 | 10,000 | 10,000 |
| 5 | Farmers | 2 | 20 | 10 | 400 | 400 |
| 6 | In Seminars | 6 | 6 | 300 | 1,800 | 1,800 |
| 7 | World Environment Day | 1 | 23 | 300 | 6,900 | 6,900 |
| 8 | World Earth Day | 1 | 5 | 300 | 1,500 | 1,500 |
| 9 | World Ozone Day | 1 | 3 | 300 | 900 | 900 |
| 10 | Nature Watch | 3 | 3 | 300 | 900 | 900 |
| 11 | Birds Watch | 3 | 3 | 300 | 900 | 900 |
| 12 | Water Watch | 3 | 3 | 300 | 900 | 900 |
| 13 | Forest Watch | 3 | 3 | 300 | 900 | 900 |
| 14 | Emission Test Camp | 2 | 2 | 300 | 600 | 600 |
| 15 | Group Discussion | 2 | 2 | 300 | 600 | 600 |
Grand total |
3,99,800 |
3,99,800 |
||||
STATISTICS REPORT OF TOTAL NUMBER OF TREE SAPLINGS DONATED, PLANTED AND TREES GROWN
The static report of total number of Saplings donated through our “Save Earth and Environment to Save Life’ Service, total numbers of saplings planted by eco-lovers and total numbers of Trees grown in the last 20 years is as follows: -
Tree Saplings donated to |
|||||||
| Sl. No. | Name of the Program | Total No. of Tree Saplings distributed | Total No. of Tree Saplings Planted | Total No. of Trees Grown | |||
|---|---|---|---|---|---|---|---|
| 1 | Govt. of India campus | 1,250 | 1,250 | 1,250 | |||
| 2 | Baharat Scout’s & Guides | 750 | 750 | 750 | |||
| 3 | All Karnataka Children’s Association | 2,500 | 2,500 | 2,500 | |||
| 4 | All Karnataka Children’s Association | 1,000 | 1,000 | 1,000 | |||
| 5 | Sarvodaya Education Society | 500 | 500 | 500 | |||
Grand total |
6,000 |
6,000 |
6,000 |
||||